
At LOR Graphic Design, we specialize in creating professional and visually compelling presentations that help organizations present complex data in a clear and engaging way. Our expertise in data-driven presentation design is showcased through our work with Ajman Census, where we transformed statistical information into meaningful visual narratives that enhance audience engagement and understanding.
About Ajman Census:
Census Goals are collecting and disseminating information about the demographic, social, and economic properties of the population. Measurement of common conditions regarding population growth, the geographical distribution of the population, age-sex distribution, educational status, marriage & divorce, fertility, deaths, career structure, economic activities…etc.
Service Overview:
Our custom PowerPoint presentation design ensures that key census insights, demographic data, and statistical reports are communicated effectively. This presentation is designed for:
✅ Government Briefings
✅ Public Awareness Campaigns
✅ Executive Reports
✅ Community Engagement Meetings
Objectives: Data-Driven Presentation
Key Features: Data-Driven Presentation
Custom Branding & Visual Identity
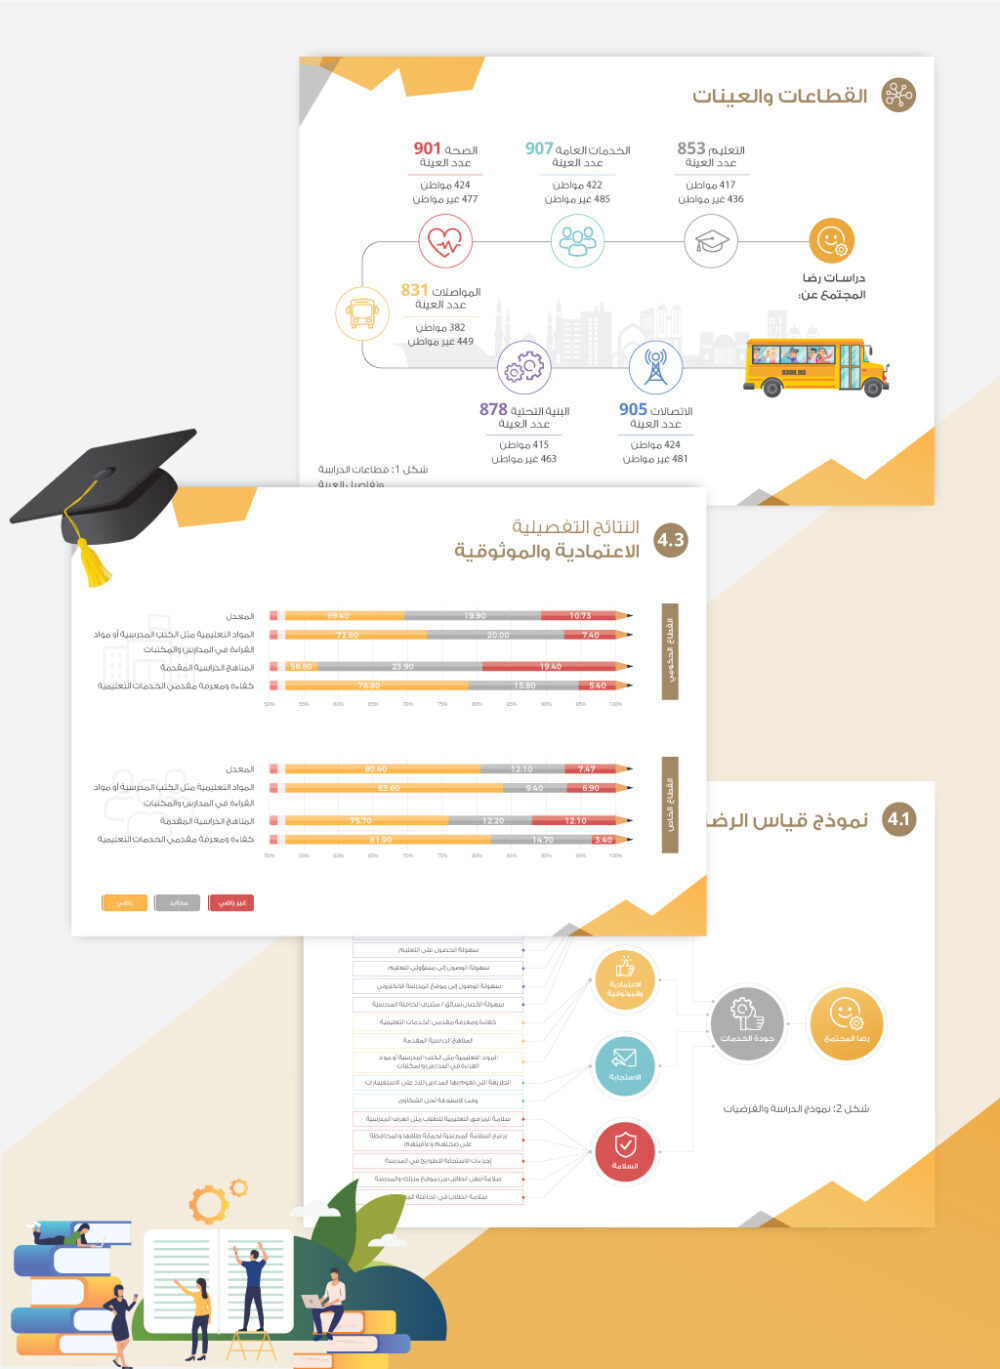
Infographics & Data Visualization
Interactive & Multimedia Integration
User-Friendly & Editable Slides
Benefits for Ajman Census:
✅ Data Clarity: Complex statistics are visually simplified for better comprehension.
✅ Professional Image: Enhances credibility in government & public presentations.
✅ Time-Saving Templates: Allows for quick updates in census reports.
✅ Engaging & Informative: Ensures stakeholders and the public stay informed.
Enhance Your Presentation with LOR Graphic Design!
Whether you need a data-driven report, public briefing, or government presentation, we provide high-quality, impactful presentation designs tailored to your needs.